
 Radiohead performing at the Coachella Valley Music and Arts Festival in Indio, California on May 1, 2004. The last show of their Hail to the Thief tour. (g_leon_h/CC 2.0 License)
*this is meant to be a quick comparison, not an in-depth critique
Though 99 percent of users have no reason to access Spotify’s developer tools and data-driven Insights, they offer a deep dive into the characteristics of individual and societal music tastes and trends. Spotify Insights allow you to measure the ‘danceability’ and ‘valence’, or positivity, of a song. Though the tools are powerful, comparisons of covers and alternate takes reveal the strength of the ‘valence’ measure, and the comical, albeit inconsistent, failings of the ambiguous concept of ‘danceability’
The tools on Spotify Insights come by way of a subsidiary, The Echo Nest. Spotify Inc. purchased The Echo Nest, a self-described music intelligence and data-performance company in 2014. Since then, the streaming juggernaut has incorporated the company’s music tools into their Spotify Insights page.
Users can analyze playlists and songs for standard metrics of BPM or release date; but, more interestingly, the ‘danceability’ and ‘valence’ of songs illustrates something I would’ve thought difficult—the emotionality and, for the lack of a better word, vibe of a song.
Valence v. Danceability
A 2013 post from The Echo Nest’s Eliot Van Buskirk, now migrated to the Spotify Insights page, gave a simple explanation of ‘valence’ as it relates to the data. For The Echo Nest, valence is “to describe whether something is likely to make someone feel happy (positive valence) or sad (negative valence).” He went on to admit “It’s no easy feat to have a computer listen to a song in three seconds and determine its emotional valence, but we’ve figured out how to do it” with one notable, human-addition to the process being the use of a “music expert classify some sample songs by valence, then use machine-learning to extend those rules to all of the rest of the music in the world, fine tuning as we go.”
Buskirk’s data shows the relative ‘valence’ of popular music has remained near-neutral since the 1950s.
I came to this concept through a video from online music-critic, The Needle Drop, discussing a 2017 blog post from ‘RCharlie’ discussing Radiohead—a band known for producing some of the most depressing records to date.
‘RCharlie’ found the use of valence-alone to be of limited reliability, and adapted the measure to account for lyrics, i.e. identifying words and lyrics typically associated with “sadness.” The results were ostensibly pretty accurate. Radiohead’s latest album, 2016’s “A Moon Shaped Pool” came out as far and away the saddest album—a fact one listen will confirm.
Buskirk’s data shows the relative ‘valence’ of popular music has remained near-neutral since the 1950s.
‘Danceability’ would seem, but is not necessarily opposed to ‘valence’. A favorite band of mine, LCD Soundsystem produces songs crafted for an analog sense of ‘danceability’, but with lyrics often rivaling Thom Yorke & Co. for depression.
A 2010 blog post from members of The Echo Nest team describes ‘danceability’ as inherently subjective: “The Echo Nest defines danceability as the ease with which a person could dance to a song, over the course of the whole song. We use a mix of features to compute danceability, including beat strength, tempo stability, overall tempo, and more.”
As someone who invests more attention to the lyrics of songs, I’m curious how covers stack up to originals, and how alternate takes from the same artists change things. Really, how much weight are lyrics in how danceable or sad a song is—or how we perceive those metrics. Covers often slow down and rework songs, revealing the power (or lack of power) of lyrics. In no case is that more clear than in downtrodden songs.
Covers
One of the best known covers is Jeff Buckley’s version of Leonard Cohen’s “Hallelujah”. If you’re attempting to dance to either, you’re probably a good candidate fro psychiatric treatment. Cohen’s words are depressing, recounting Samson and Delilah. Yet despite the use of Cohen’s lyrics, Buckley’s version is substantially lower in valence, i.e. has a negative valence (i.e. is more sad, according to the Spotify/Echo Nest algorithm). Cohen’s version relies on his well-known Greek choir backing, and has a bit more variation musically. That might account for the difference. Both are well below a song of average-valence, or neutrality in regards to positivity/negativity (at 50).
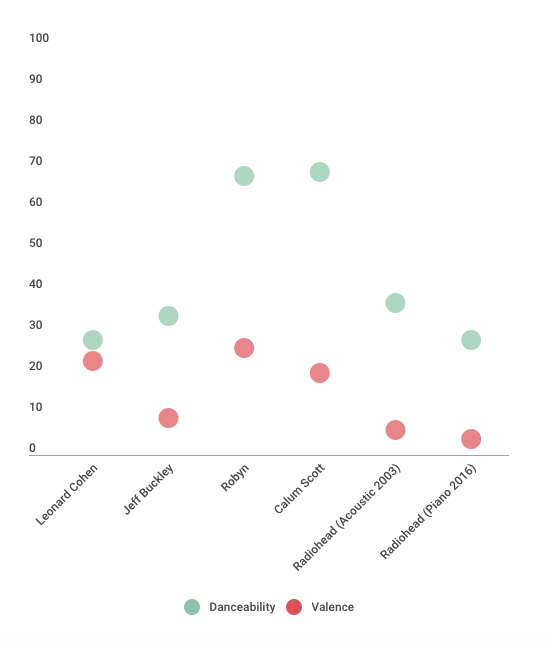
A more telling example would be a song whose cover is radically different, and more importantly, with the inclusion of a song irrefutably belonging to the ‘dance’ category. Robyn’s “Dancing on My Own” provides that. Whereas Robyn’s lyrics are somewhat ambivalent, certainly edging toward sad, her music is upbeat and crafted for danceability. Callum Scott’s cover, however, turns the song into a sappy piano-ballad.
Surprisingly, despite being polar-opposites in regards to non-lyrical music, both versions are nearly identical. Robyn’s original scores a danceability of 68 versus Scott’s 69, whereas the original scores a 26 in valence, with Scott’s at 20.
This similarity shows the limitation of this algorithm. Despite being very good at measuring valence, as both songs are nearly equal in that regard, the danceability measure is bizarre. Placing Robyn’s version as one-notch below Scott’s in this metric is comical. One listen defeats that argument.
Alternate Takes
The song referenced earlier, “True Love Waits” by Radiohead is the epitome of a low-valence record. It is depressing, in both music and lyrics. Them Yorke premiered the song in the 1990s, but waited until 2016 to release the track on a proper album. In between, he transitioned it from an acoustic guitar ballad to a phantasmagoric piano ballad. The first recording has an air of potential change, while the second is resigned and defeated, both containing one of Yorke’s finest and saddest lyrics, “I’m not living, I’m just killing time.” The second record came after Yorke and his partner and co-parent of 23 years, Rachel Owen separated, and a half a year or so before her untimely death from cancer. That lamentation is painfully-clear in the reworking of this song.
All of this is to say, this record went from typical Radiohead-sad, to a remarkable new level.
The inclusion of danceability here is just for consistency. Both versions make “Hallelujah” sound like “Beat It”. The 2003 live-recording of the song has a danceability of 37 versus 28 for the later version, and a valence of six compared to four for the 2016 version.
The similarity in valence, again, shows the strength of this metric. ‘Sad’ music can have such a wide-variety of sounds, from ABBA to Otis Redding to Nas to Amy Winehouse to Mozart to Beyoncé. The Spotify metric purposefully does not rely on key alone, as a minor key gives an almost instant impression of sadness, from which the lyrics might deviate.
As for the variation in ‘danceability,’ I put that more to the difficulty in assessing this quality, which stands to be far more subjective than even valence. In my Spotify Top Songs of 2017, the most danceable songs was “Oh Devil” by Electric Guest at 90, the least was “Lust for Life” by Iggy Pop at 20. For valence, the most positive was “Scarlet Begonias” by the Grateful Dead at 92, the most negative being “Waves” by Kanye West at 6. Just from a music listener point of view, I again find the valence numbers to be far more reflective of reality. It’s hard to get more positive than “Scarlet Begonias“.
*The Spotify Insights page can be found here.
